Best Practices In Scientific Computing
Overview
Teaching: 30 min
Exercises: 30 minQuestions
What does best practice mean?
What should I be doing?
What should I try to avoid?
Objectives
Appreciate guidelines for best practice
Work through an exercise demonstrating some of these practices
Be less scared about testing and documentation
Best Practices In Scientific Computing
While computer science and software engineering have different goals than scientific computing, many of the best practices in these disciplines are still applicable to scientific computing.
Since the top priority of scientific computing is to have software that produces correct results, we can make our lives easier by adopting practices that make our code or scripts easier to understand (by humans) so that errors can be found and fixed easily. Additionally, since our research work is continuously changing it is very likely that we will revisit our scripts to re-use them (in part or in whole) or expand their use. Here again readability and clarity will be of benefit, but so will version control, and modularization.
Here are some guiding principles that should be followed when planning or writing scripts, regardless of language:
| Guideline | Description |
|---|---|
| Clarity over efficiency | Prioritize writing clear code over efficient code. Make use of programming idioms1. Do standard things in standard ways. Write code for humans to understand in the first instance, and only secondarily for computers. |
| Naming is important | Choose meaningful and useful names for variables/functions/classes/scripts. Typically: objects are nouns, functions are verbs, pluralize variables that represent lists or collections. Unhelpful names can be annoying to work with, whilst confusing names can be downright destructive. |
| Don’t repeat yourself | When something works reuse it. Bundle repeated code into functions and call those functions. Bundle functions into modules that can be imported. Write simple (single intent) tools that can be easily incorporated into larger workflows. |
| Don’t repeat others | If something seems routine then there is almost always an existing solution that you can rely on. Look for existing libraries/modules or programs that you can make use of. Don’t reinvent the wheel2 |
| Document | You will forget what you did and why you did it. Write yourself a document that describes the problem you were trying to solve, the approach that you took, and how you solved it. If the solution is a script, then describe how to use the script including the inputs, what options are available, and what the output is. This can be a README.md file, docstrings (in python) or a pdf. The format is less important than the fact that the documentation exists. |
| Test | Only the very lucky get things right the first time. Don’t rely on luck. When you write a script, do something to convince yourself that it works. Manually inspecting results for a known example is form of testing. This of testing as validation. |
| Version control | When moving towards a solution we often make a wrong turn. Use a version control system to create a ‘checkpoint’ or ‘save point’ that you can easily come back to if things go bad. You don’t need to do pull requests, branching, merging, or upload your files to GitHub for version control to be useful. |
| Avoid premature optimization | Optimization can save time in the term run but always costs time in the short term. Optimize your time by firstly solving the problem, and only engage in optimization after you find out that your code is taking too long or using too many resources3. |
In this lesson we will focus on repetition, version control, testing, documentation, and repetition. To demonstrate the utility of these topics we’ll be working on a common task - analyzing meteorite falls around the world.
Use case - visualizing a data set
Let’s go through the process of visualizing some data and see if we can incorporate the above best practices as we go. We will be working with a data file that contains information about meteorites that have fallen in Australia, and our aim is to plot the location of the meteorites, and give an indication of their masses.
To begin with we need to obtain the data. We have a nice data set prepared for you which you can download the data with the command4:
wget https://raw.githubusercontent.com/ADACS-Australia/HWSA-2022/gh-pages/data/Australian_Meteorite_Landings.csv
# or if the above didn't work, then try
curl -O https://raw.githubusercontent.com/ADACS-Australia/HWSA-2022/gh-pages/data/Australian_Meteorite_Landings.csv
We will start with a peak inside this file with the head command:
head Australian_Meteorite_Landings.csv
output
id,mass (g),reclat,reclong
5051,488.1,-33.15639,115.67639
48653,324.0,-31.35,129.19
7743,30.0,-31.66667,152.83333
10033,127.0,-29.46667,151.61667
10120,26000.0,-33.35,146.85833
12264,41730.0,-35.08333,139.91667
16643,330000.0,-26.45,120.36667
16738,8887.5,-40.975,145.6
16766,11300.0,-29.8,141.7
From this you can see that we have given you a .csv file recording meteorites that have landed in Australia.
The four columns represent an ID, a mass, and a recorded position in latitude and longitude.
We’ll use python for our visualization, so we begin by reading the file with python. Reproducing the above quick summary in python we would write a script like the following:
# the csv library has a lot of read/write functions for csv files
import csv

csv_list = []

# opening the CSV file
with open('Australian_Meteorite_Landings.csv', mode ='r') as file:
  # read the CSV file
  csv_reader = csv.reader(file)

  # loop over the lines in the file and add each to our list
  for line in csv_reader:
        csv_list.append(line)

# print the first 10 lines to ensure that we are on the right track.
print(csv_list[:10])
output
[['id', 'mass (g)', 'reclat', 'reclong'], ['5051', '488.1', '-33.15639', '115.67639'], ['48653', > '324.0', '-31.35', '129.19'], ['7743', '30.0', '-31.66667', '152.83333'], ['10033', '127.0', '-29.> 46667', '151.61667'], ['10120', '26000.0', '-33.35', '146.85833'], ['12264', '41730.0', '-35.08333', > '139.91667'], ['16643', '330000.0', '-26.45', '120.36667'], ['16738', '8887.5', '-40.975', '145.6'], > ['16766', '11300.0', '-29.8', '141.7']]
At this point we should save our work in a file and make sure that we are on the right track by running the script and inspecting the output. Since we have just started our new project and have some initial progress, this is a great time to set up our version control.
Start a new project
- Create a new directory for your project with a name that makes sense to you
- Save your initial python script as
plot_meteorites.py(what we’ll eventually be doing)- Run your script and ensure that it’s not broken
- Initialize a git repository in this directory by typing
git init- Tell git that you want this new file to be tracked by using
git add <filename>- Also commit your data file using the same technique
- Save your initial progress by creating a new commit to your repository via
git commit -m > <message>
- The first commit message can be something simple like “initial version”
- Check that you have committed your progress by running
git log
If at any point we are editing our work and we break something, or change our mind about what we are doing, so long as we have the files under version control we can go back to our previous save point using:
git checkout -- <filename>
If we want to reach way back in time we can do
git checkout <hash> <filename>
Where the <hash> is one of the long alphanumeric strings that are shown when we run git log.
Having good commit messages will make it easier to tell which commit we should be going back to.
Now we have some first step that we can come back to later if we mess things up. Let’s try and do something with this data - computing the mean mass of the meteorites. We can do this by adding the following to our script and re-running:
import numpy as np

all_mass = []

# csv_list[1:] will skip the first line which is our header (not data)
for id, mass, lat, long in csv_list[1:]:
    # skip missing data
    if mass != "":
        # Convert string -> float and append to our list
        all_mass.append(float(mass))

# Output mean of the masses
print("The mean mass is:", np.mean(all_mass), "g")
...
The mean mass is: 80919.38811616955 g
Save your progress
- Once our script is in a working state, save it, add it to git, and then commit it
- Use a commit message that describes what we did in less than 50 chars
- Double check your git log to see that the changes have been applied
The above is fine but that was a bit of work for what feels like a very standard task. Let’s be guided by the “don’t repeat others” mentality, and see if we can find an existing solution that will do this work for us. The python data analysis library pandas has a lot of great functionality built around data structures called data frames which are a fancy kind of table. So if we let pandas do all the hard work for us then we can extend our above code with the following:
# Use the pandas library
import pandas as pd

# read a csv file into a data frame
df = pd.read_csv('Australian_Meteorite_Landings.csv')

# Have a look at the data
print("csv data\n--------------------------")
print(df)

# Use pandas to do some quick analysis
print("\npanda describe\n--------------------------")
print(df.describe())
output
...
csv data
--------------------------
        id   mass (g)    reclat    reclong
0     5051      488.1 -33.15639  115.67639
1    48653      324.0 -31.35000  129.19000
2     7743       30.0 -31.66667  152.83333
3    10033      127.0 -29.46667  151.61667
4    10120    26000.0 -33.35000  146.85833
..     ...        ...       ...        ...
638  30359      262.5 -32.03333  126.17500
639  30361   132000.0 -14.25000  132.01667
640  30362    40000.0 -31.19167  121.53333
641  30373   118400.0 -29.50000  118.75000
642  30374  3800000.0 -32.10000  117.71667

[643 rows x 4 columns]

panda describe
--------------------------
                 id      mass (g)      reclat     reclong
count    643.000000  6.370000e+02  643.000000  643.000000
mean   19219.513219  8.091939e+04  -30.275400  130.594478
std    14869.941958  1.029442e+06    2.940091    7.655877
min      471.000000  0.000000e+00  -41.500000  114.216670
25%    10136.500000  3.280000e+01  -30.841665  126.587915
50%    15481.000000  1.291000e+02  -30.383330  128.916670
75%    23537.500000  2.426000e+03  -30.086415  132.008335
max    56644.000000  2.400000e+07  -12.263330  152.833330
With only a few lines we can load the data and have a quick look. You can see that the count of mass is only 637 out of 643 so pandas has recognized that there is missing mass data and has even calculated a mean mass for us.
Save your progress
- Once our script is in a working state, save it, add it to git, and then commit it
- Use a commit message that describes what we did in less than 50 chars
- Double check your git log to see that the changes have been applied
Now that pandas is doing all the file reading and format handling for us we can do away with our previous attempt at reading a csv file.
Delete some code and check it in
- Delete all the code before the “import pandas as pd” command
- Run
git statusto see which files have changed- Run
git diff plot_meteorites.pyto see what changes have been made to the file- Run the script and confirm that it still works
- Add and commit our work to our git repository
Pre-existing solutions
See if you can identify a python package (module) that will help you with each of the following tasks:
- Read
.fitsformat images- Create a ‘corner plot’ from multi-dimensional data
- Plot images using sky coordinates using the correct projection
- Read and write
.hdf5format data files- Solve equations analytically/exactly
- Train and evaluate machine learning models
Head over to the python package index at pypi.org, and search for the packages you found.
In our shared document make a note of a package that you wish existed, and then look at the wish list of others and see if you can suggest a (partial) solution.
In the above challenge you may have seen a few modules that occur frequently, either because they are large and multi-purpse modules, or because they are fundamental and used as a building block for many others.
For example, scipy and numpy are fundamental to most of the scientific computing libraries that are built, and packages like astropy are becoming very widely use in astronomy.
If you have noticed a bias towards python in our teaching examples, it is because of this rich ecosystem of freely available and easy to use modules. The large adoption within the astronomy community, also means that it is easy to get relevant and specific help from your peers. As you work in other fields you’ll notice that different software packages are standard and usually for the same reason - easy of access, and access to support. At the end of the day the right tool is the one that gets the job done, and you should not be afraid of exploring beyond python to get your work done.
Visualizing data
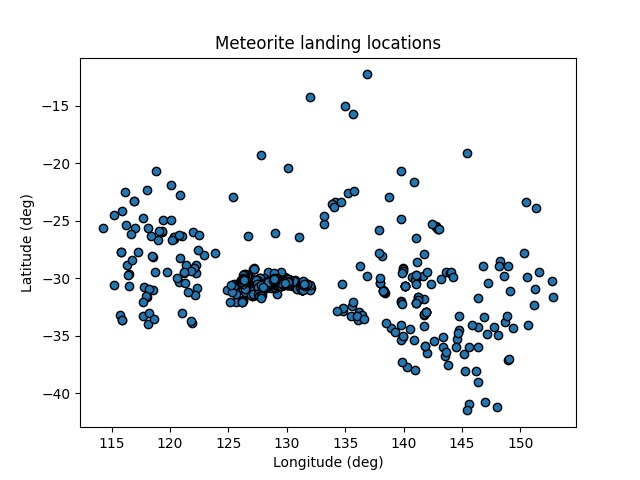
Back to our main task of making a nice plot of our data. Let’s make a scatter graph of the locations of the meteorites using the matplotlib module.
Since this should be a simple task, we shouldn’t be supprized to find that we can complete it in a few lines of code. Add the following to our script and run it:
# import the plotting library with a short name
import matplotlib.pyplot as plt

# make a scatter plot
plt.scatter(df['reclong'], df['reclat'], edgecolors='0')

# label our plot!
plt.xlabel("Longitude (deg)")
plt.ylabel("Latitude (deg)")
plt.title("Meteorite landing locations")

# pop up a window with our plot
plt.show()
Our first plot
Save your progress
- Commit your changes to the plotting script.
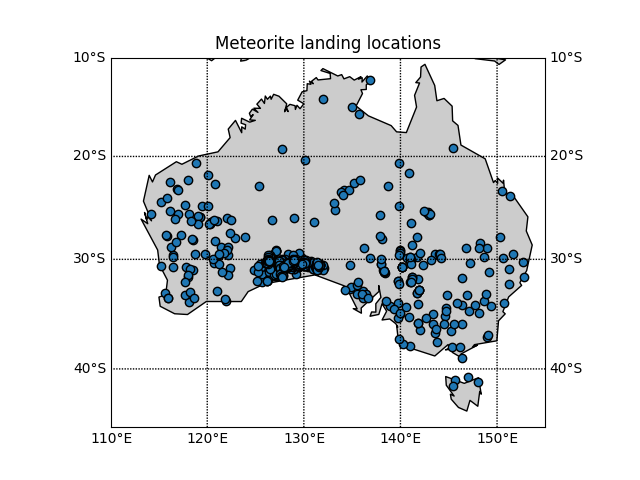
Our plot looks vaguely Australia shaped but to be sure lets plot this against a map of Australia to make sure we believe the locations. Doing this manually would be difficult so, after some Googling, we have found a python module that can do it for you called Basemap
Replace the previous plotting section of your script with the following:
from mpl_toolkits.basemap import Basemap
import numpy as np
import matplotlib.pyplot as plt

fig=plt.figure()

# setup map projection
bm = Basemap(
    llcrnrlon=df['reclong'].min()-5,  # Lower left corner longitude
    urcrnrlon=df['reclong'].max()+5,  # Upper right corner longitude
    llcrnrlat=df['reclat'].min()-5,   # Lower left corner latitude
    urcrnrlat=df['reclat'].max()+5,   # Upper right corner latitude
)

# Draw in coasline and map lines
bm.drawcoastlines()
bm.fillcontinents()
bm.drawparallels(np.arange(-90,90,10),  # The location of the parallels
                 labels=[1,1,0,1])      # Which axes to show labels on
bm.drawmeridians(np.arange(-180,180,10),labels=[1,1,0,1])

# Convert your data to the Basemap coordinates and add it to the plot
x, y = bm(df['reclong'], df['reclat'])
plt.scatter(x, y,
            edgecolors='0',
            zorder=2) # make the points be in front of the basemap
plt.show()
Our second plot
Save your progress
- Commit your changes to the plotting script.
Creating a reusable script
This is looking great but before we go any further we should make the plotting component into a function as part of a script so it’s easier to rerun for different locations on the Earth. Moving commonly used code into a function, rather than just copy/pasting it, is ane example of don’t repeat yourself.
Let’s take all of the plotting part of our script and put it into a function called plot_meteor_locations, and allow the user to supply a data frame with the data, and a bounding box of lat/long for the plotting area.
Since this function is something that we’ll be using often, it’s a good idea to write some documentation for the function.
In python we can use a docstring to show what the function is supposed to do and what the expected inputs ared.
Alternatively we could write a short noted in a REDEME.md file that describes how to use the program.
import matplotlib.pyplot as plt
from mpl_toolkits.basemap import Basemap
import pandas as pd
import numpy as np


def plot_meteor_locations(df):
    fig=plt.figure()

    # setup map projection
    bm = Basemap(
        llcrnrlon=df['reclong'].min()-5,  # Lower left corner longitude
        urcrnrlon=df['reclong'].max()+5,  # Upper right corner longitude
        llcrnrlat=df['reclat'].min()-5,   # Lower left corner latitude
        urcrnrlat=df['reclat'].max()+5,   # Upper right corner latitude
    )

    # Draw in coasline and map lines
    bm.drawcoastlines()
    bm.fillcontinents()
    bm.drawparallels(np.arange(-90,90,10),  # The location of the parallels
                     labels=[1,1,0,1])      # Which axes to show labels on
    bm.drawmeridians(np.arange(-180,180,10),labels=[1,1,0,1])

    # Convert your data to the Basemap coordinates and add it to the plot
    x, y = bm(df['reclong'], df['reclat'])
    plt.scatter(x, y,
                edgecolors='0',
                zorder=2) # make the points be in front of the basemap
    plt.show()
    return

if __name__ == '__main__':
    # read a csv file into a data frame
    df = pd.read_csv('Australian_Meteorite_Landings.csv')
    plot_meteor_locations(df)
Now you have a script that is easy to rerun if you want to recreate the plot and if anyone asks you how you generated the results you can show them your script so you can go through the steps one by one to confirm their validity.
Let’s focus on New Zealand
- Verify that your code works and then commit the changes to your repo
- Download the New Zealand data file
- Edit your script to use the new data file, save, and rerun
Making your script re-usable
Right now if someone wants to use your script they would have to import that function into their own script like this:
from plot_meteorites import plot_meteor_locations
# ... load a data frame called df
plot_meteor_locations(df)
However, it is often nice to have a basic command line interface.
In python any arguments that we pass to the program are stored in a list, and we can access this list from the sys module via sys.argv.
If we want to read the name of the data file from the command line we can modify our if __main__ clause like this:
import sys

# ... the rest of our code

if __name__ == '__main__':
    # get the filename from the command line as the last argument
    csv_file = sys.argv[-1]
    # read a csv file into a data frame
    df = pd.read_csv(csv_file)
    plot_meteor_locations(df)
Here the sys.argv[-1] refers to the last argument that was given.
It will always be interpreted as a string, and in this case we’ll use it as a filename.
add a command line interface
- modify your code so that it reads the name of the data file from the command line
- test your code by running it on both the Australia and New Zealand data
- commit your changes to your repository (including the new data file)
Testing
Testing is something that many people think is too much work to bother with. However, we are always testing our code even if we don’t think of it that way. Any time you run your code and compare the behavior/output with expectations is a test. Testing is not hard, and we already do it so let’s just embrace that.
In the previous challenge we ran our code on two different data sets, and then inspected the output to confirm that the code was working as intended. To do that we ran the following bash commands:
python3 plot_meteorites.py New_Zealand_Meteorite_Landings.csv
python3 plot_meteorites.py Australian_Meteorite_Landings.csv
If we were to make some changes to our code, it is a good idea to re-run these tests to make sure that we haven’t broken any of the existing functionality.
If we are adding some new functionality, or fixing some bug, then it would be good to have a new test to run to verify that the new parts of the code are working as intended.
To remind ourselves of how we do the testing lets make a file to record the process.
In fact, we can just make a file called test.txt which includes the above two lines of code and maybe a short description of what is expected.
When we want to run the test we just open the file and follow the instructions, copy/paste the lines of code as required.
If we think back to our lesson on scientific computing and automation we can take this a step further.
We could write test.sh with the same lines of code as test.txt (and convert the instructions into comments), and then use source test.sh to have all the code execute automatically.
As your testing becomes more involved you’ll eventually want to look into some more automated ways of not just running the tests, but ensuring that the tests all pass.
For this you’ll have to come up with some quantitative measures of what pass/fail look like, and then write a bit of code that will check against these conditions.
If/when you get to this point you should start thinking about using a testing framework such as pytest to help with the automation and organization of the tests.
(You still have to write them yourself though!)
Create test file
- Create either
test.txtortest.shusing the example above- Do/run the test
- Commit the test file to your git repo
Documentation
Documenting your code is important as it makes it clear how you code generates your results and shows others (and yourself) how to use your code. There are several levels of documentation and what level is appropriate depends on the purpose, complexity and who will use your code.
Documentation levels include:
- Code comments
- README.md
--helpor docstrings (Python)- readthedocs.io which can host your documentation and using sphinx you can automate it’s generation
- A user guide (pdf or markdown) to explain how to use the code with explanations and common examples
Considering your audience is a good indicator of what documentation level you should aim for
- You in 6 months time (level 1-3)
- Other developers of the code (level 1-4)
- Other users (level 4-5)
Markdown (.md) is a common syntax to generate documentation, for example a README.md will automatically be rendered on GitHub.
Lets create a README.md for your code.
# Meteorite Analysis Software
This git repository contains python scripts to analyze meteorite data for my research, which is bound to win me the noble prize.

## Installation
This software isn't installable (yet), but it's always good to describe how to install your software. Some common ways to install python scripts include

`python setup install`

or

`pip install .`

## Data
It is always best to note where your data came from and describe how to use it.

### Australian_Meteorite_Landings.csv
Data downloaded from https://raw.githubusercontent.com/ADACS-Australia/HWSA-2022/gh-pages/data/Australian_Meteorite_Landings.csv.
A truncated version of the data from https://data.nasa.gov/Space-Science/Meteorite-Landings/ak9y-cwf9.

id: NASA meteorite

mass (g): Mass of the meteorite in grams

reclat: Recorded latitude in degrees

reclong: Recorded longitude in degrees

## Running Software
Create analysis plots using:

`python plot_meteorites.py`
You can use VSCode extensions to view the rendered version or push it to GitHub to view it on the webpage. This will remind you how to use your code and where you got your data.
Create a README file for your repo
- Create a
README.mdfile in your repo- Add your name, an description of the intent of the repo, and what the various files do
- Commit this file to your git repo
-
See programming idioms ↩
-
Re-inventing the wheel can be a great learning experience, however when you are focusing on getting work done, it’s most often not a good use of your time. ↩
-
wgetisn’t available via gitbash, butcurlis so windows users may have to usecurl↩
Key Points
Validation is testing
Documentation benefits everyone (especially you)
Version control will save you time and effort