Benchmarking and profiling
Overview
Teaching: 15 min
Exercises: 15 minQuestions
What is benchmarking?
How is benchmarking different from profiling?
How can I benchmark and profile my code?
Objectives
Benchmark a job on gadi
Profile a simple script on our local machine
Understand what our profiling results are telling us
We are working toward optimization and parallel computing. We need to understand the current state of our code before we should even think about optimization or parallel computing.
Benchmarking vs Profiling
These two processes are quite similar in that they involve running a program and then measuring the resources that were used. You can think of benchmarking is the high-level view of a process, where as profiling is zooming in to each of the lines of code to understand where all the resources are being used.
The primary resources that people track are:
- Time to execute,
- CPU usage,
- RAM usage,
- GPU usage, and
- Disk usage (I/O)
When benchmarking, it is common to look at the average, peak, or total value for each of these resources. When you have benchmarked your software you will then have an understanding of how it performs in it’s current state, and what resources are required on an HPC, or when purchasing new equipment.
When you are profiling a piece of code, you are typically trying to understand why it is using the given resource (usually because you’d like to use less of them). When profiling the same resources are tracked, however they are usually tracked at a much higher cadence, and often at the level of each line of code.
Benchmarking
Benchmarking is the process of running code on a target system to determine the typical behavior or resource usage. Benchmarking is different from profiling, in that with profiling we want a detailed report of what our software is doing at various times with an eye to improving the program, where as benchmarking is only interested in estimating how much resources are required to run a program in it’s current state. In the context of this workshop we are mostly interested in determining the resource usage in terms of:
- run time
- peak RAM use
- CPU utilization
The peak RAM use and CPU usage will determine how many copies of our task we can run on a node at once, which we can then multiply by the total run time to estimate our kSU requirement.
Whilst it’s possible to estimate the cpu/time/ram requirements by running tasks on a desktop and then “scaling up” the results, this is an unreliable method, and usually requires a buffer of uncertainty. The best method is to run some test jobs on the target machine and then ask SLURM how much resources were used for those jobs.
On an HPC system like NCI, your benchmarking is super easy.
Every time you run a job, the output file (specified with #PBS -o filename) will have a resource usage report at the end.
For example, our first_script.sh job has the following report:
======================================================================================
                  Resource Usage on 2023-03-20 22:53:37:
   Job Id:             77478053.gadi-pbs
   Project:            vp91
   Exit Status:        0
   Service Units:      0.07
   NCPUs Requested:    1                      NCPUs Used: 1
                                           CPU Time Used: 00:00:00
   Memory Requested:   200.0MB               Memory Used: 6.42MB
   Walltime requested: 00:05:00            Walltime Used: 00:02:01
   JobFS requested:    100.0MB                JobFS used: 0B
======================================================================================
I can’t overstate just how amazingly convenient it is that on gadi we get these reports for all our jobs. Pawsey and OzStar (which use SLURM instead of PBSPro) don’t do this automatically, and so users need to dig through the slurm databases to try and reconstruct the information.
Profiling
We’ll be using the scalene package to profile our python code.
Unlike other profiling systems, scalene doesn’t require you to edit the source code as part of the profiling process.
Instead you simply run scalene your_prog.py and it will run your code and deliver a report.
Guess what is slow?
Before we run/view the output from
scalenehave a read through the code and have a guess at what you think will be the slowest part.Comment in the etherpad. Make it spicy and add a bet if you are confident.
view the scalene output
Run
scalene sky_sim.pyand view the ouput. Scalene will create aprofile.htmlfile and then open it in your default browser for you to view.(my) profile
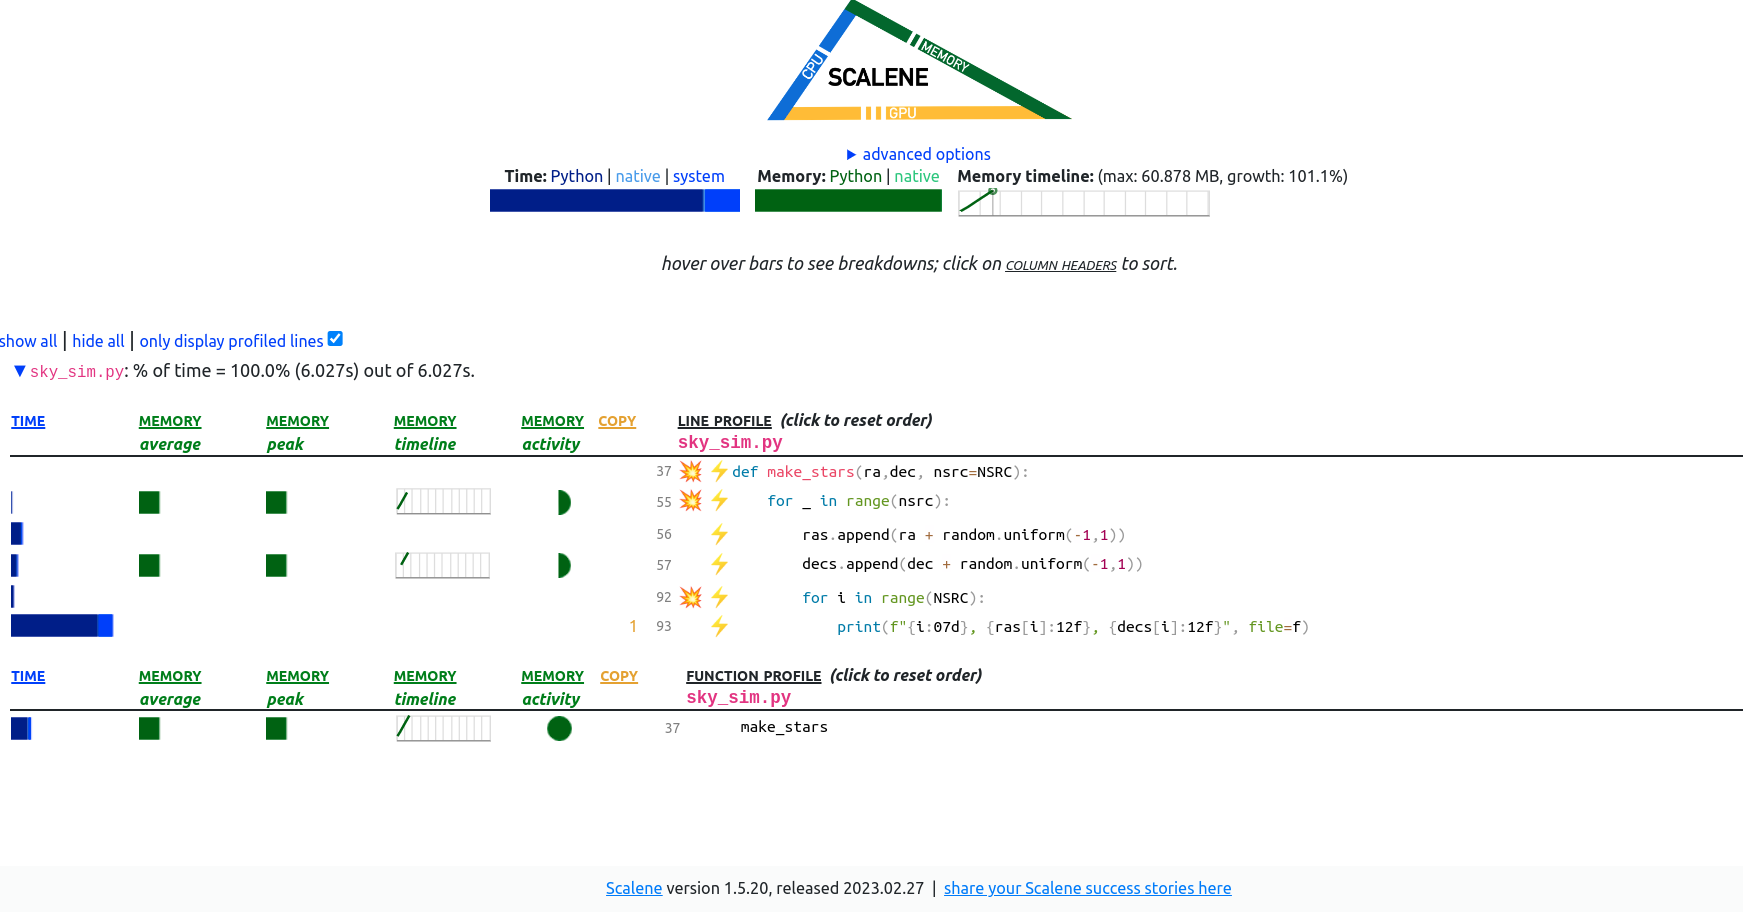
Scalene reports time and memory usage for the entire run (top of the page), and then on a per-line and per-function basis (lower page). Note that not every line in the code has been profiled and only the profiled lines have been shown. The reason is that some lines of code take such a short amount of time to execute that scalene doesn’t bother to capture this timing. If you want to see the entire file all at once then uncheck the box “only display profiled lines”.
At the top of the page, scalene divides the time into three components: Python, native, and system.
- Python: How much time was spent in Python code.
- Native: How much time was spent in non-Python code (e.g., libraries written in C/C++).
- System: How much time was spent in the system (e.g., I/O).
- GPU: (not shown above) How much time spent on the GPU, if your system has an NVIDIA GPU installed.
In order to reduce the total time, it is often advisable to convert python time into native time, which means replacing your python functions with system libraries.
Using numpy modules is a great way to do this.
Pro tip
NUMpy is more than just numerical python, there are a lot of functions that do things like read/write files, transform data types, and provide convenience functions for testing.
When it comes to reducing the memory footprint in python you are a bit limited, because python intentionally does the memory management for you. Python also likes to hang on to memory ‘just in case’ it might need it in the future, and it can be hard to convince python to just let it go. If you want to use less memory, just don’t allocate it in the first place! By which I mean, don’t copy things, use numpy arrays that, when sliced, will give you views into the same memory space rather than copies of the sub array.
Key Points
Before trying to improve/optimize your code, you need a starting point
Benchmarking is a broad measure of resource usage
Profiling is a very fine-grained look at resource usage