Benchmarking and profiling
Overview
Teaching: 30 min
Exercises: 30 minQuestions
What is benchmarking?
How is benchmarking different from profiling?
How can I benchmark and profile my code?
Objectives
Profile a simple script on our local machine
Understand what our profiling results are telling us
Measuring resource usage
Your software programs will take some time to run, and require some computing resources to do so. Once you have a piece of code that works as intended it is often beneficial to understand how much of these various resources are required. Understanding this resource usage can help you to plan your research project timeline and secure the hardware required. If the total run time on your target machine is long, then often people want to shorten this by optimizing the code to run faster. If you are applying for time on a super-computing system the application process will often require you to estimate the total resources that you’ll need for your work. Thus even if you are not going to engage in optimization, it can be important to understand how much resources your code requires.
In this workshop, we are working toward optimization and parallel computing. We need to understand the current state of our code before we should even think about optimization or parallel computing.
Benchmarking vs Profiling
These two processes are quite similar in that they involve running a program and then measuring the resources that were used. You can think of benchmarking is the high-level view of a process, where as profiling is zooming in to each of the lines of code to understand where all the resources are being used.
The primary resources that people track are:
- Time to execute,
- CPU usage,
- RAM usage,
- GPU usage, and
- Disk usage (I/O)
When benchmarking, it is common to look at the average, peak, or total value for each of these resources. When you have benchmarked your software you will then have an understanding of how it performs in it’s current state, and what resources are required on an HPC, or when purchasing new equipment.
When you are profiling a piece of code, you are typically trying to understand why it is using the given resource (usually because you’d like to use less of them). When profiling the same resources are tracked, however they are usually tracked at a much higher cadence, and often at the level of each line of code.
Benchmarking
Benchmarking is the process of running code on a target system to determine the typical behavior or resource usage. Benchmarking is different from profiling, in that with profiling we want a detailed report of what our software is doing at various times with an eye to improving the program, where as benchmarking is only interested in estimating how much resources are required to run a program in it’s current state. In the context of this workshop we are mostly interested in determining the resource usage in terms of:
- run time
- peak RAM use
- CPU utilization
The peak RAM use and CPU usage will determine how many copies of our task we can run on a node at once, which we can then multiply by the total run time to estimate our kSU requirement.
On your linux based machine
Using time
The program time will run your program and give you a very short report on how much time was taken.
It is used as follows:
time python3 mymodule/sky_sim.py
and will produce output showing the real/user/sys time:
Wrote catalog.csv

real    0m2.777s
user    0m2.674s
sys     0m0.102s
The times are as follows:
- real is the total time of execution (stop - start) or the “wall time”
- user is how much time was spent executing the code (stop - start)*(cpu usage) or the “cpu time”
- sys is the amount of time spent executing code within the system kernel (i/o, memory allocation, networking, etc)
Note: The “user” time can be larger than the “real” time if your code makes use of multiple cpu cores.
Using top
The program top will show you the real time cpu/ram usage for all of your running processes.
The problem is that this is all your running processes, and it can be hard to keep track of the one process you are interested in.
The following bash script will run a given program, and the use top to track the resource usage over time:
#! /usr/bin/env bash
# run the given command as a background process and hide output
$* &>/dev/null &
# Capture the process id of the above process
pid="$!"
# quit this script if someone presses Ctrl+C
trap exit SIGINT
# print the top output including header info
top -b n1 -n1 -p "$pid"
# check if the program is still running
while test -d /proc/"$pid"/ ; do
    # get the top info for this process
    top -b n1 -n1 -p "$pid"  | tail -1
    # sleep for 0.2 seconds before the next output
    sleep 0.2
done
The above code is in the file benchmarking.sh.
As with any benchmarking / profiling work, you need to consider the fact that your computer is doing more than just run your code. At the very least it is also running the benchmarking/profiling software, but this should incur a very small memory/cpu overhead. When benchmarking you should:
- Have as few other programs running as possible,
- Try to make sure that your RAM use is minimal to start with, this will avoid swapping,
- Run your benchmark multiple times to get a confident answer, and to determine how much caching is playing a role.
Benchmark your
sky_sim.py
- Use
timeto record the real/user/sys run time for your code- Use the benchmarking script above to watch the resource usage from
topwhile running your code
If you want to determine how much resources are going to be required to run your program on an HPC system, then your first estimate would be based on running on your local machine and the “scaling up” the results. Note however that this is going to be a rough estimate only, as an HPC has many more components in play than your local machine. With your rough “scaled up” estimate you can often ask for some director’s time to build and run your software on an HPC with the goal of estimating the total resource requirements that you’ll be requesting.
On PBSTorque systems like Gadi
Whilst it’s possible to estimate the cpu/time/ram requirements by running tasks on a desktop and then “scaling up” the results, this is an unreliable method, and usually requires a buffer of uncertainty. The best method is to run some test jobs on the target machine and then ask SLURM how much resources were used for those jobs.
On an HPC system like NCI, your benchmarking is super easy.
Every time you run a job, the output file (specified with #PBS -o filename) will have a resource usage report at the end.
An example report is as follows:
======================================================================================
                  Resource Usage on 2023-03-20 22:53:37:
   Job Id:             77478053.gadi-pbs
   Project:            vp91
   Exit Status:        0
   Service Units:      0.07
   NCPUs Requested:    1                      NCPUs Used: 1
                                           CPU Time Used: 00:00:00
   Memory Requested:   200.0MB               Memory Used: 6.42MB
   Walltime requested: 00:05:00            Walltime Used: 00:02:01
   JobFS requested:    100.0MB                JobFS used: 0B
======================================================================================
Benchmarking on SLURM systems like Pawsey and OzStar
Whilst it’s possible to estimate the cpu/time/ram requirements by running tasks on a desktop and then “scaling up” the results, this is an unreliable method, and usually requires a buffer of uncertainty.
The best method is to run some test jobs on the target machine and then ask SLURM how much resources were used for those jobs.
The key to this method is the sacct (SLURM accounting) task.
In the example below I run sacct on a job that has completed:
sacct -j 29780362
JobID           JobName  Partition    Account  AllocCPUS      State ExitCode
------------ ---------- ---------- ---------- ---------- ---------- --------
29780362           test    skylake      oz983          4    TIMEOUT      0:0
29780362.ba+      batch                 oz983          4  CANCELLED     0:15
29780362.ex+     extern                 oz983          4  COMPLETED      0:0
There area few things to unpack here so lets go in order of columns:
- JobID - This shows all the jobs you asked to see. Note that there are three job steps shown here.
- 29780362 - This is the parent job, this row will show summary attributes that include all other steps.
- 29780362.ba+ - this is the “batch” job, what was executed within your bash script.
- 29780362.ex+ - this is the “external” tasks that were run, typically this will be small/none in terms of resource usage
- 29780362.0 - [Not shown above] steps that end in a
.<number>are created each time you usesrunto launch a task. Unless you are using mpi jobs this is not required so you may not see this.
- JobName - The name of the job/step
- Partition - The cluster name or partition that the job ran on
- Account - The account that will be charged for the resources used
- AllocCPUS - The number of CPUs that were allocated to the job
- State - The final state of the job
- CANCELLED Job was cancelled by the user or a sysadmin
- COMPLETED Job finished normally, with exit code 0
- FAILED Job finished abnormally, with a non-zero exit code
- OUT_OF_MEMORY Job was killed for using too much memory
- TIMEOUT Job was killed for exceeding its time limit
- ExitCode - The (highest) exit code for the job along with the signal that caused it to exit in the format exitcode:signal
In the above example, I submitted a task that requested minute wall time. The job ran over time and was therefore cancelled by SLURM. The SLURM controller sent signal 15 (SIGTERM) to the script which caused it to exit with code 0.
What else can
sacctdo?Read the
manpages forsacctand see what other reporting options are available. For a short hand view trysacct -e.
sacct -eAccount AdminComment AllocCPUS AllocNodes AllocTRES AssocID AveCPU AveCPUFreq AveDiskRead AveDiskWrite AvePages AveRSS AveVMSize BlockID Cluster Comment Constraints Container ConsumedEnergy ConsumedEnergyRaw CPUTime CPUTimeRAW DBIndex DerivedExitCode Elapsed ElapsedRaw Eligible End ExitCode Flags GID Group JobID JobIDRaw JobName Layout MaxDiskRead MaxDiskReadNode MaxDiskReadTask MaxDiskWrite MaxDiskWriteNode MaxDiskWriteTask MaxPages MaxPagesNode MaxPagesTask MaxRSS MaxRSSNode MaxRSSTask MaxVMSize MaxVMSizeNode MaxVMSizeTask McsLabel MinCPU MinCPUNode MinCPUTask NCPUS NNodes NodeList NTasks Priority Partition QOS QOSRAW Reason ReqCPUFreq ReqCPUFreqMin ReqCPUFreqMax ReqCPUFreqGov ReqCPUS ReqMem ReqNodes ReqTRES Reservation ReservationId Reserved ResvCPU ResvCPURAW Start State Submit SubmitLine Suspended SystemCPU SystemComment Timelimit TimelimitRaw TotalCPU TRESUsageInAve TRESUsageInMax TRESUsageInMaxNode TRESUsageInMaxTask TRESUsageInMin TRESUsageInMinNode TRESUsageInMinTask TRESUsageInTot TRESUsageOutAve TRESUsageOutMax TRESUsageOutMaxNode TRESUsageOutMaxTask TRESUsageOutMin TRESUsageOutMinNode TRESUsageOutMinTask TRESUsageOutTot UID User UserCPU WCKey WCKeyID
For our current needs the relevant fields are as follows:
| Field | Description |
|---|---|
| TimeLimit | How much time was allocated to the job |
| Elapsed | How much time was used by the job |
| NCPUS | allocated number of CPUS |
| UserCPU | Time spent on user time (the program you ran) |
| SystemCPU | Time spent on system time (libraries called by your program) |
| TotalCPU | Total time spent (User + System) |
| CPUTime | NCPUS * Elapsed |
| ReqMem | Requested memory |
| MaxRSS | Maximum RSS (used memory) |
| MaxVMSize | Maximum VMSize (addressable memory ) |
We can use these fields to get the following information:
sacct -j  29780362 -o JobID,TimeLimit,Elapsed,NCPUS,UserCPU,SystemCPU,TotalCPU,CPUTime,ReqMem,MaxRSS,MaxVMSize
JobID         Timelimit    Elapsed      NCPUS    UserCPU  SystemCPU   TotalCPU    CPUTime     ReqMem     MaxRSS  MaxVMSize
------------ ---------- ---------- ---------- ---------- ---------- ---------- ---------- ---------- ---------- ----------
29780362       00:01:00   00:01:16          4  00:03.649  00:02.291  00:05.941   00:05:04         4G
29780362.ba+              00:01:19          4  00:03.649  00:02.290  00:05.939   00:05:16                  572K    211236K
29780362.ex+              00:01:16          4   00:00:00  00:00.001  00:00.001   00:05:04                   88K      4380K
For this particular job we requested 4 CPUs and used 3.649 seconds of user time, 2.291 seconds of system time, for a total of 5.941 seconds, and ran for 1minute 16seconds. The amount of time that could have been used if we had used all 4 CPU cores at 100% is 5:04 minutes, meaning that we used less than 1% of the allocated resources. We requested 4GB of RAM but had a peak VMSize of just 212MB, meaning that we could have requested less RAM. For my example task I would have been charged 1minute x 4 cores worth of resources, but have made use of less than 1% of those resources.
When benchmarking your jobs, it is clearly important to have the jobs run successfully.
Once a job runs successfully you can then use sacct to figure out the time, CPU, and RAM usage.
Note that the sacct system only polls the jobs at some interval (30seconds?) and therefore it is possible that the MaxVMSize will not capture short duration peaks in RAM usage.
This polling interval also means that your jobs that run overtime will not always be cancelled exactly at the wall time requested (see the example above).
Profiling
Profiling is much like benchmarking except that you are interested in a more fine grained view of your resource usage.
Typically you’ll be looking to measure the resource usage as a function of time or, even better, of lines of code executed.
Profiling tools will add a compute/memory overhead to your software, but should ultimately track their own resource usage and subtract that from the reported amount.
You can use most profiling tools for benchmarking by taking the peak/total resource usage.
We’ll be using the scalene package to profile our python code.
Unlike other profiling systems, scalene doesn’t require you to edit the source code as part of the profiling process.
Instead you simply run scalene your_prog.py and it will run your code and deliver a report.
Guess what is slow?
Before we run/view the output from
scalenehave a read through the following code and have a guess at what you think will be the slowest part.
sky_sim.py#! /usr/bin/env python """ Simulate a catalog of stars near to the Andromeda constellation """ import argparse import math import random NSRC = 1_000_000 def get_radec(): """ Generate the ra/dec coordinates of Andromeda in decimal degrees. Returns ------- ra : float The RA, in degrees, for Andromeda dec : float The DEC, in degrees for Andromeda """ # from wikipedia andromeda_ra = '00:42:44.3' andromeda_dec = '41:16:09' degrees, minutes, seconds = andromeda_dec.split(':') dec = int(degrees)+int(minutes)/60+float(seconds)/3600 hours, minutes, seconds = andromeda_ra.split(':') ra = 15*(int(hours)+int(minutes)/60+float(seconds)/3600) ra = ra/math.cos(dec*math.pi/180) return ra, dec def crop_to_circle(ras, decs, ref_ra, ref_dec, radius): """ Crop an input list of positions so that they lie within radius of a reference position Parameters ---------- ras,decs : list(float) The ra and dec in degrees of the data points ref_ra, ref_dec: float The reference location radius: float The radius in degrees Returns ------- ras, decs : list A list of ra and dec coordinates that pass our filter. """ ra_out = [] dec_out = [] for i in range(len(ras)): if (ras[i]-ref_ra)**2 + (decs[i]-ref_dec)**2 < radius**2: ra_out.append(ras[i]) dec_out.append(ras[i]) return ra_out, dec_out def make_stars(ra, dec, nsrc=NSRC): """ Generate NSRC stars within 1 degree of the given ra/dec Parameters ---------- ra,dec : float The ra and dec in degrees for the central location. nsrc : int The number of star locations to generate Returns ------- ras, decs : list A list of ra and dec coordinates. """ ras = [] decs = [] for _ in range(nsrc): ras.append(ra + random.uniform(-1, 1)) decs.append(dec + random.uniform(-1, 1)) # apply our filter ras, decs = crop_to_circle(ras, decs, ra, dec, 1) return ras, decs def skysim_parser(): """ Configure the argparse for skysim Returns ------- parser : argparse.ArgumentParser The parser for skysim. """ parser = argparse.ArgumentParser(prog='sky_sim', prefix_chars='-') parser.add_argument('--ra', dest='ra', type=float, default=None, help="Central ra (degrees) for the simulation location") parser.add_argument('--dec', dest='dec', type=float, default=None, help="Central dec (degrees) for the simulation location") parser.add_argument('--out', dest='out', type=str, default='catalog.csv', help='destination for the output catalog') return parser if __name__ == "__main__": parser = skysim_parser() options = parser.parse_args() if None in [options.ra, options.dec]: central_ra, central_dec = get_radec() else: central_ra = options.ra central_dec = options.dec ras, decs = make_stars(central_ra, central_dec) # now write these to a csv file for use by my other program with open(options.out, 'w') as f: print("id,ra,dec", file=f) for i in range(len(ras)): print(f"{i:07d}, {ras[i]:12f}, {decs[i]:12f}", file=f) print(f"Wrote {options.out}")Comment in the etherpad. Make it spicy and add a bet if you are confident.
view the scalene output
Run
scalene sky_sim.pyand view the ouput. (Note that I increased the NSRC to be 5million so we would have a longer run time). Scalene will create aprofile.htmlfile and then open it in your default browser for you to view.(my) profile
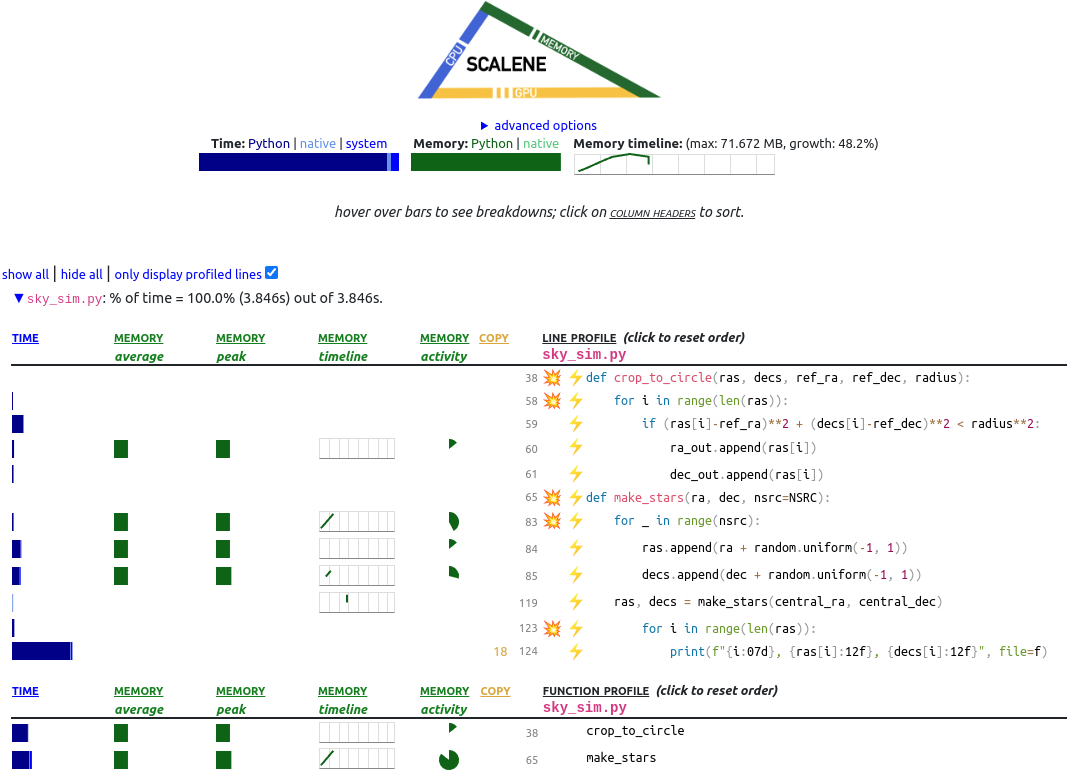
Scalene reports time and memory usage for the entire run (top of the page), and then on a per-line and per-function basis (lower page). Note that not every line in the code has been profiled and only the profiled lines have been shown. The reason is that some lines of code take such a short amount of time to execute that scalene doesn’t bother to capture this timing. If you want to see the entire file all at once then uncheck the box “only display profiled lines”.
At the top of the page, scalene divides the time into three components: Python, native, and system.
- Python: How much time was spent in Python code.
- Native: How much time was spent in non-Python code (e.g., libraries written in C/C++).
- System: How much time was spent in the system (e.g., I/O).
- GPU: (not shown above) How much time spent on the GPU, if your system has an NVIDIA GPU installed.
In order to reduce the total time, it is often advisable to convert python time into native time, which means replacing your python functions with system libraries.
Using numpy modules is a great way to do this.
Pro tip
NUMpy is more than just numerical python, there are a lot of functions that do things like read/write files, transform data types, and provide convenience functions for testing.
Note, however, in the above output that the program spends about 60% of the total run time on line 123, which is formatting and writing the output file. Thus, even if numpy were magically fast at computing, we would only ever be able to reduce our run time by 40%. Let’s move on to the next lesson optimisation where we can talk about what to do with the above report.
Key Points
Before trying to improve/optimize your code, you need a starting point
Benchmarking is a broad measure of resource usage
Profiling is a very fine-grained look at resource usage